0
About
No items found.
Speak with us
Lorem ipsum dolor sit amet, consectetur adipiscing elit. Suspendisse varius enim in eros elementum tristique. Duis cursus, mi quis viverra ornare
View all fees
DriversPressRA WorkshopContact
0
Learn how championship-winning engineers read speed, brake and throttle traces to pinpoint exactly where lap time is lost. Learn the step-by-step process ACI Motorsports uses to turn race data into measurable gains on track.
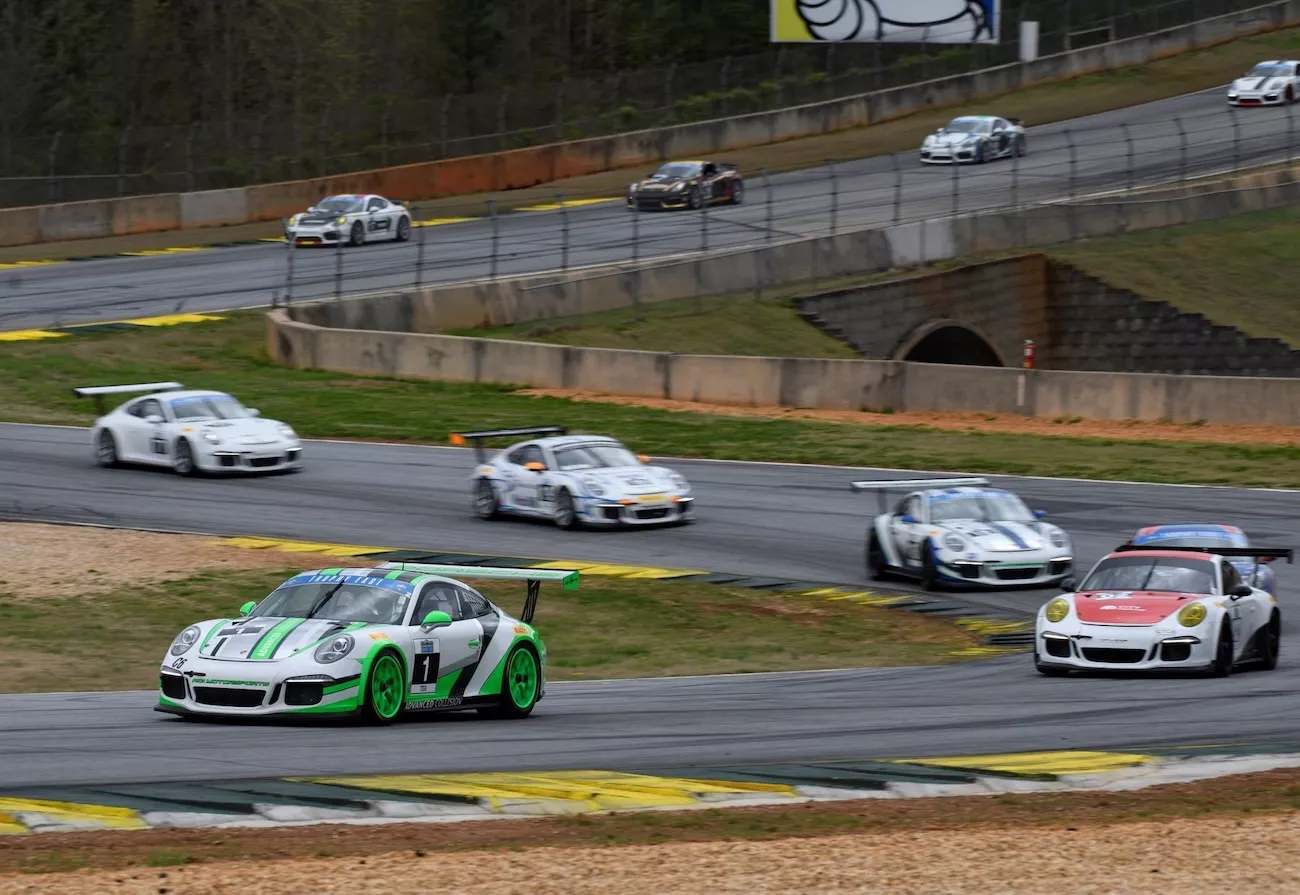
Race data analysis is the process of recording what a race car and its driver do on every lap, comparing those laps to find exactly where time is being lost, and turning that evidence into specific driving and setup changes. It is how professional teams convert feel into facts, and facts into lap time.
Every driver has a lap they know they left time on. The data shows exactly where it went. At ACI Motorsports, we analyze data from every session our Porsche entries run in Porsche Carrera Cup North America, Pirelli GT4 America and beyond. It sits at the center of how we prepare cars, coach drivers and compete for championships. This guide explains how that process works, from the first sensor reading to the moment a driver crosses the line faster than before.
Key Takeaways
A modern race car is a rolling laboratory. Sensors record dozens of channels many times per second, from pedal positions and steering angle to suspension movement and tire temperatures. On their own, those numbers are noise. Race data analysis is the discipline of turning them into decisions, and it follows three stages.
Collect: The car's data logger records every channel for every lap, through practice, qualifying and the race.
Compare: Engineers overlay laps against each other. That might be a driver's best lap against their average lap, one session against the next, or one driver against a teammate or benchmark lap.
Act: The differences become a short, prioritized list of changes, some for the driver and some for the car, which are then tested on the next run.
The value is never in the charts themselves. It is in the quality of the questions an experienced engineer asks of them.
The two terms are often used interchangeably, but they describe different things. Telemetry is data transmitted from the car to the pit wall in real time, so engineers can watch the car live. Data logging is data recorded on board and downloaded when the car returns to the pits.
Most detailed lap time analysis is done on logged data between sessions. Live telemetry, where a series permits it, is used mainly to monitor car health and support strategy. In everyday paddock language, "the data" usually means both.
Race car data falls into five broad groups, and each one answers a different question about performance.
Driver inputs such as throttle position, brake pressure, steering angle and gear show exactly what the driver asked the car to do, and when they asked for it.
Vehicle motion channels, including speed, GPS position and lateral and longitudinal g-force, show how the car actually responded and the line it took around the circuit.
Chassis data such as damper travel, ride height and wheel speeds reveal how the suspension and platform behave over bumps and curbs and under load.
Tire and brake channels track tire temperatures and pressures alongside brake temperatures. They show whether each is working in its optimal window and how performance degrades over a run.
Engine and systems data, from RPM and oil pressure to water temperature and fuel, monitors mechanical health and provides early warning of potential problems.
A driver development session might focus almost entirely on the first two groups. A setup session leans heavily on the chassis and tire channels. The skill lies in knowing which channels answer the question in front of you, and setting the rest aside until they matter.
Open a professional analysis package and you can plot hundreds of channels. Experienced engineers start with just a handful, because these five traces explain most of the lap time difference between any two laps.
The speed trace plots the car's speed around the lap, and it is the foundation of everything else. Straights appear as rising lines, braking zones as steep drops and corners as valleys. The lowest point of each valley is the minimum corner speed, one of the most revealing numbers in the entire data set.
Engineers look for a sharp transition at the top of every braking zone and a clean, steady climb out of every corner. A flat section just before a braking zone suggests the driver lifted early and coasted. A dip or wobble after the lowest point of a corner can mean a mid-corner correction or a lift on exit. When two laps are overlaid, the gap between the lines shows exactly where one lap carried more speed than the other.
If the speed trace is the foundation, the time delta is the map. It compares two laps continuously and shows the running time difference between them. When the line rises, the lap being studied is losing time to the reference. When it falls, it is gaining time. When it stays flat, the two laps are level.
Engineers open the delta first because it answers the most important question immediately: where on the track is the time? A lap might be three tenths slower overall, yet the delta often reveals that most of the deficit comes from just two or three corners. That focus is what turns improvement from a vague goal into an achievable plan.
The brake trace shows brake pressure through every braking zone. A strong trace typically features a rapid initial application, a sustained peak as the car slows and a progressive release as the driver turns in. That final phase is a technique known as trail braking.
The most common issues are:
Braking zones are where drivers gain and lose the most time over the shortest distance, so this is often where the coaching conversation begins.
The throttle trace shows how much throttle the driver is using and when. The critical moments are the point where the driver returns to the throttle after a corner, how quickly they reach full throttle and whether that application is smooth or hesitant.
A trace that picks up, backs off and picks up again usually signals a driver who does not yet trust the car's balance on exit. That can point to a setup issue as much as a technique one. Exit speed matters enormously because it carries all the way down the following straight. A small improvement here often shows up as a much larger gain on the delta.
The friction circle plots lateral g-force from cornering against longitudinal g-force from braking and acceleration. A driver using all of the available grip keeps the plot tracing around the outside edge, blending braking into cornering and cornering into acceleration without any gaps.
Points clustered in the middle of the circle show moments where the car is doing less than it could. These moments often fall between releasing the brake and turning in, or between the apex and full throttle. It is one of the clearest ways to see how completely a driver is using the tires.
Traces can be plotted against time or against distance around the lap. For comparing two laps, distance is the standard. It lines both laps up at the same point on track, so a braking point or turn-in marker sits in the same place on both lines.
Time-based plots are useful for other jobs, such as reviewing how events unfold across a stint. For finding lap time, distance keeps every comparison honest.
Here is how the five traces work together in practice. The example below reflects a pattern engineers see regularly in a heavy braking zone leading into a slow corner, the kind of corner found at nearly every road course in North America.
Step 1: The delta finds the loss: The driver is a few tenths away from their target pace. The delta shows a clear rise through one braking zone and along the straight that follows, making it the biggest single loss on the lap.
Step 2: The brake trace narrows it down: Overlaid against the reference lap, the driver reaches peak pressure at a similar point. However, they release the brake earlier and more abruptly, before the car has rotated toward the apex.
Step 3: The speed trace confirms the consequence: With the brake released early, the car runs slightly wide, and the driver has to wait for it to turn. The minimum speed is lower and arrives later in the corner.
Step 4: The throttle trace reveals the knock-on effect: Throttle application is delayed and hesitant, so exit speed is down and the deficit keeps growing along the entire next straight.
Step 5: The fix is specific: Rather than a vague instruction to "brake later," the coaching point becomes a precise change to how the driver releases the brake into the corner. The engineer also checks the chassis data to confirm the car's entry balance supports that technique.
Step 6: The next run validates it: The driver heads back out, and the delta through that section flattens. The improvement is confirmed by data, not by feel alone.
This is the core loop of race data analysis: one corner, one cause, one change and one measurable result. Repeat it across a lap and across a season, and the gains compound.
One of the most valuable skills in race engineering is diagnosing whether lost time comes from the driver, the car or both. Changing the setup to fix a technique problem, or coaching a driver around a setup problem, wastes precious track time and can make things worse.
Each common symptom can have either cause, and the data shows which one is responsible.
Understeer on corner entry usually points to the driver when the brake release is abrupt or turn-in comes too early. If the understeer appears consistently even when the driver's inputs match the reference lap, the setup is the more likely culprit.
Oversteer on corner exit often comes from throttle applied too sharply or with too much steering still applied. When the rear steps out despite smooth, progressive inputs, the engineers turn their attention to the car.
Instability under braking can follow uneven brake pressure or rushed downshifts. If the car moves around under a clean, consistent brake trace, the cause lies in the chassis.
Lap times fading over a stint point to the driver when inputs become less consistent as the stint goes on. When the inputs hold steady, but tire temperatures or pressures drift out of their working window, the car and tire management need attention.
Low minimum corner speed is a driver issue when the car is being over-slowed compared with the reference lap. If the grip limit is reached with inputs that already match the reference, the answer lies in finding more grip through setup.
In practice, the answer is often a combination of both. That is why race data analysis delivers the most when the engineer, the coach and the car preparation crew work from the same information. At ACI Motorsports, a data finding never stays in a report. It becomes a coaching point through our driver coaching program and a setup direction for our engineering team.
The best teams do not treat data analysis as something that happens after the checkered flag. It runs through the entire weekend, and every session has a clear purpose.
Before the event: Engineers review data from previous visits to the circuit, including setup notes, tire behavior and the driver's past laps. From that, they build a starting setup and a set of realistic targets.
Practice: The first run establishes a baseline. From there, changes are made one at a time so their effect can be measured clearly. Change several things at once and it becomes impossible to know which one worked.
Qualifying: Practice data informs tire preparation, out-lap pace and the timing of the push lap. When the grid is decided by a single lap, preparing the tires correctly is worth as much as the lap itself.
The race: Where available, live data helps engineers keep watch over car health. Lap-by-lap timing shows how pace and tires are holding up across a stint and guides strategy calls from the pit wall. This is where our trackside support crew and engineers work side by side in real time.
After the event: Every session is reviewed and turned into a clear development plan for the next round. The findings also feed straight back into the workshop, as we explain in our guide to how ACI Motorsports prepares race cars.
Porsche's own factory engineers have described race-weekend data as primarily a tool for validation. In their view, most of the real learning takes place beforehand, through testing and structured processes. That principle holds at every level of the sport. Teams that arrive with a plan use the weekend to confirm it. Teams that arrive without one spend the weekend searching.
In a one-make series like Porsche Carrera Cup North America, every competitor races the same car, the Porsche 911 GT3 Cup. With the hardware equal, the gap between the front and the back of the field comes down to the driver and how well their team supports them.
That makes race data analysis a genuine competitive weapon. When the cars are identical, the differences between drivers are small and highly specific: a few feet of braking, a mile or two per hour of minimum speed, a fractionally earlier return to the throttle. Those are precisely the details data exposes, and the teams that read them best consistently move their drivers up the order.
The same holds true in Pirelli GT4 America, where Balance of Performance narrows the gaps between manufacturers and execution decides results. Looking ahead, Porsche has confirmed that its new 911 GT4 R, which debuts in the 2027 season, features an integrated data logger and precise GPS system built to support performance analysis. For drivers progressing through the Porsche motorsport ladder, a consistent, data-driven approach makes every step up faster and smoother.
Data is only as useful as the process behind it. These are the mistakes we see most often, particularly from drivers analyzing their own data for the first time.
There is no universal number, and any promise of one should be treated with caution. The gains depend on where the driver is in their development, how familiar they are with the car and circuit and how well the car is prepared.
What we can say with confidence is that the pattern is consistent. Drivers who are new to a car or series typically find their biggest gains early. Those gains often come from a handful of braking zones and corner exits that the data highlights straight away. More experienced drivers find smaller, harder-won gains, where margins are measured in hundredths and the analysis must go far deeper. At the front of a professional field, those hundredths separate the winner from the rest.
Often the most important gain is consistency. A driver who can repeat a strong lap time throughout a race will usually beat one who delivers a single fast lap and then fades.
Many drivers begin by analyzing their own data, and it is a worthwhile skill to build. Modern logging systems and analysis software make it possible to overlay laps, read a delta and spot obvious issues without an engineering background.
The limits appear as the gains get smaller. Self-analysis tends to show what happened, but not always why. It is also difficult to separate technique from setup when you are both the driver and the analyst. On top of that, it takes time away from what drivers should focus on between sessions: recovering, reviewing with a coach and preparing for the next run.
Working with a professional race engineer adds three things.
If you are ready for that level of support, our race data analysis services are available as standalone support or as part of a complete arrive-and-drive program.
Telemetry in racing is data sent from the car to the team in real time, covering information such as speed, throttle, braking, engine health and tire data. The term is also widely used to describe all of the data a race car records, including data logged on board and downloaded after each session.
It can be. Many professional race cars can transmit data live to the pit wall, which teams use to monitor car health and support strategy calls. What is permitted varies by series. Most detailed performance analysis is still carried out on logged data between sessions.
Most professional GT and one-make race cars use a motorsport-grade data logger fitted as part of the car's electronics, often supplied or specified by the manufacturer or series. Club racers commonly use aftermarket loggers with GPS and additional sensors. The principles of analysis are the same regardless of the system.
Most drivers can learn to read a speed trace, time delta, brake trace and throttle trace within a few sessions of guided review. Learning to diagnose the causes behind those traces, and to separate driver issues from car issues, takes much longer. That is where an experienced engineer adds the most value.
Yes, and the gains are often larger. Amateur and Pro-Am drivers usually have more lap time available to find, and data points them straight to it. It also speeds up learning a new car or circuit, which makes limited track time far more productive.
Sim racing telemetry uses the same core traces and is an excellent way to build analysis skills. Real car data adds variables a simulator cannot fully reproduce, including changing track grip, tire wear, weather, mechanical variation and the physical load on the driver. Reading real data well means accounting for all of them.
Race data analysis is not about collecting more numbers. It is about asking the right questions of them. Find where the time is with the delta. Understand why with the speed, brake and throttle traces. Decide whether the answer lies with the driver, the car or both. Then make one change, measure it and build on it.
That disciplined loop shapes how ACI Motorsports approaches every session. It has been central to our championship success, from the 2020 IMSA GT3 Cup Challenge title to the 2024 Pirelli GT4 America Pro-Am Team Championship. Whether you are preparing for your first season or chasing a title, the same process applies.
Ready to find your missing lap time? Speak with our team about our data analysis and performance services, and discover what your data is telling you.
Join ACI Motorsport and be part of a championship-winning team competing in some of North America’s most competitive racing series.
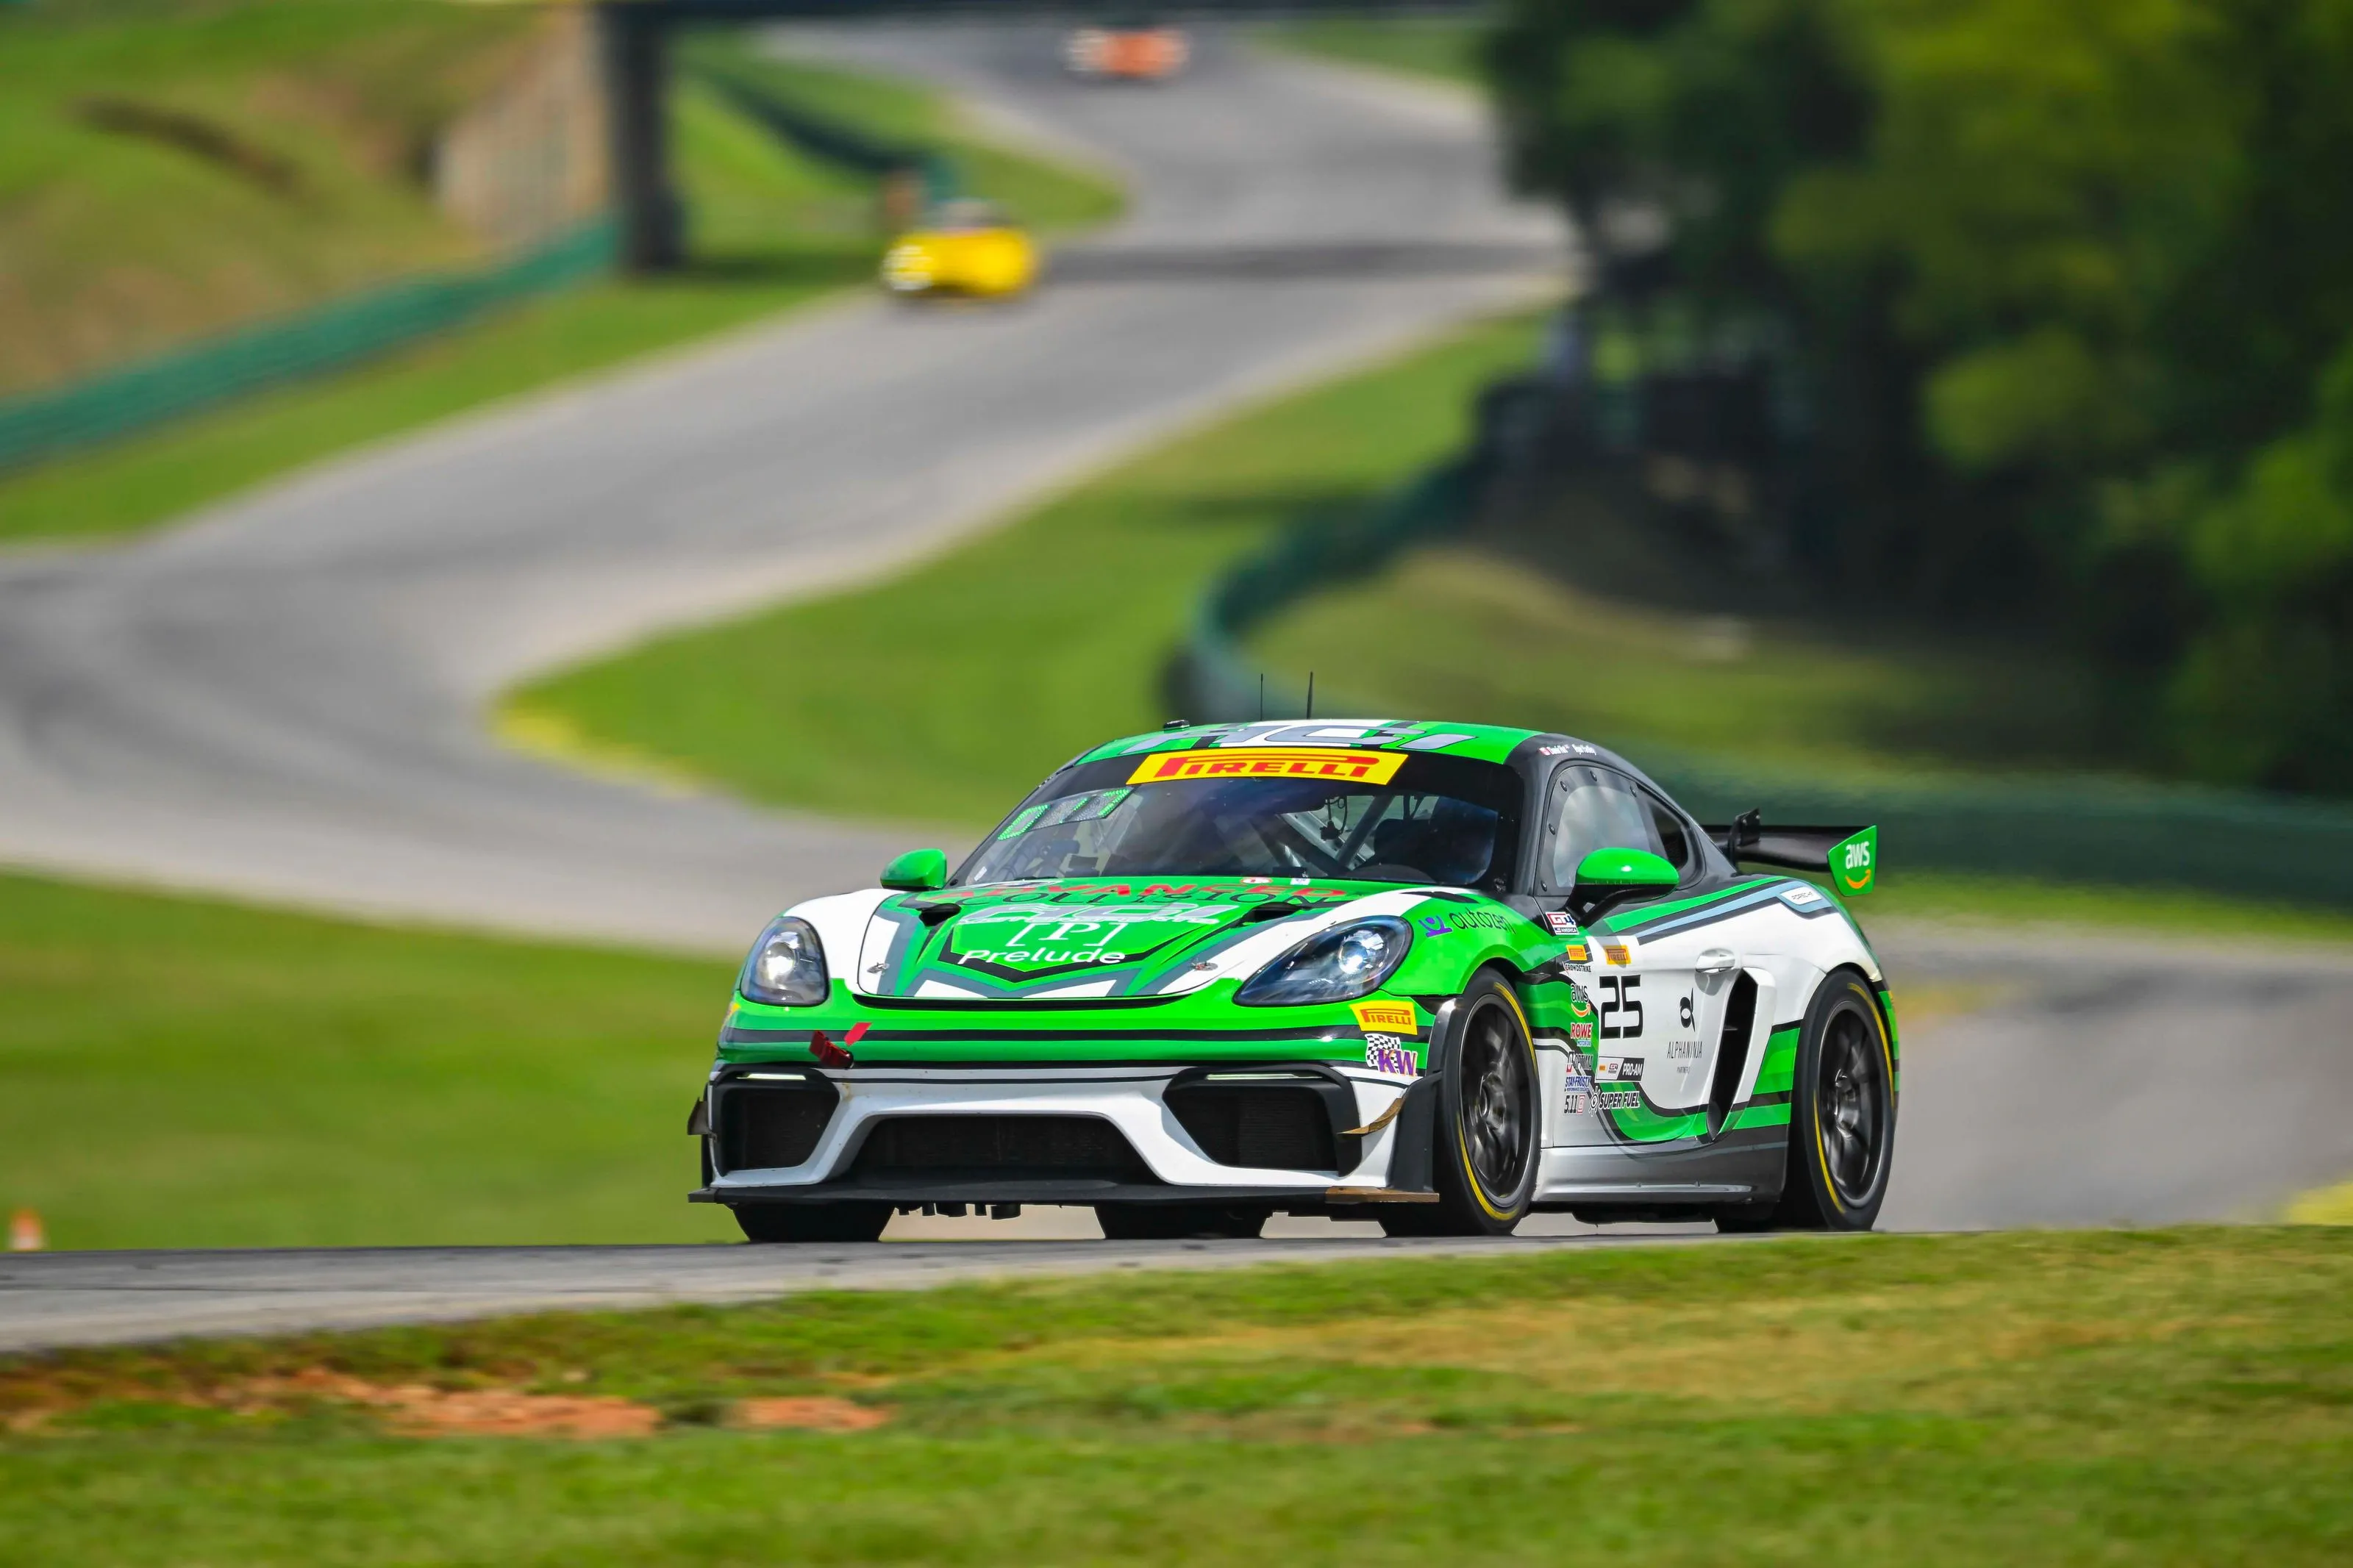
CI Motorsports takes race car preparation beyond a basic checklist, applying professional-level inspection, chassis tuning, and data-driven setup work to every Porsche GT4 before competition. From mechanical checks and suspension geometry through to trackside engineering support on race day, here is a full breakdown of how the team keeps its cars race-ready.
Sponsoring ACI offers racing fans a unique opportunity to connect with the sport on a deeper level. It allows them to be part of the action, supporting the teams and drivers they admire while gaining exclusive access to events and behind-the-scenes experiences.
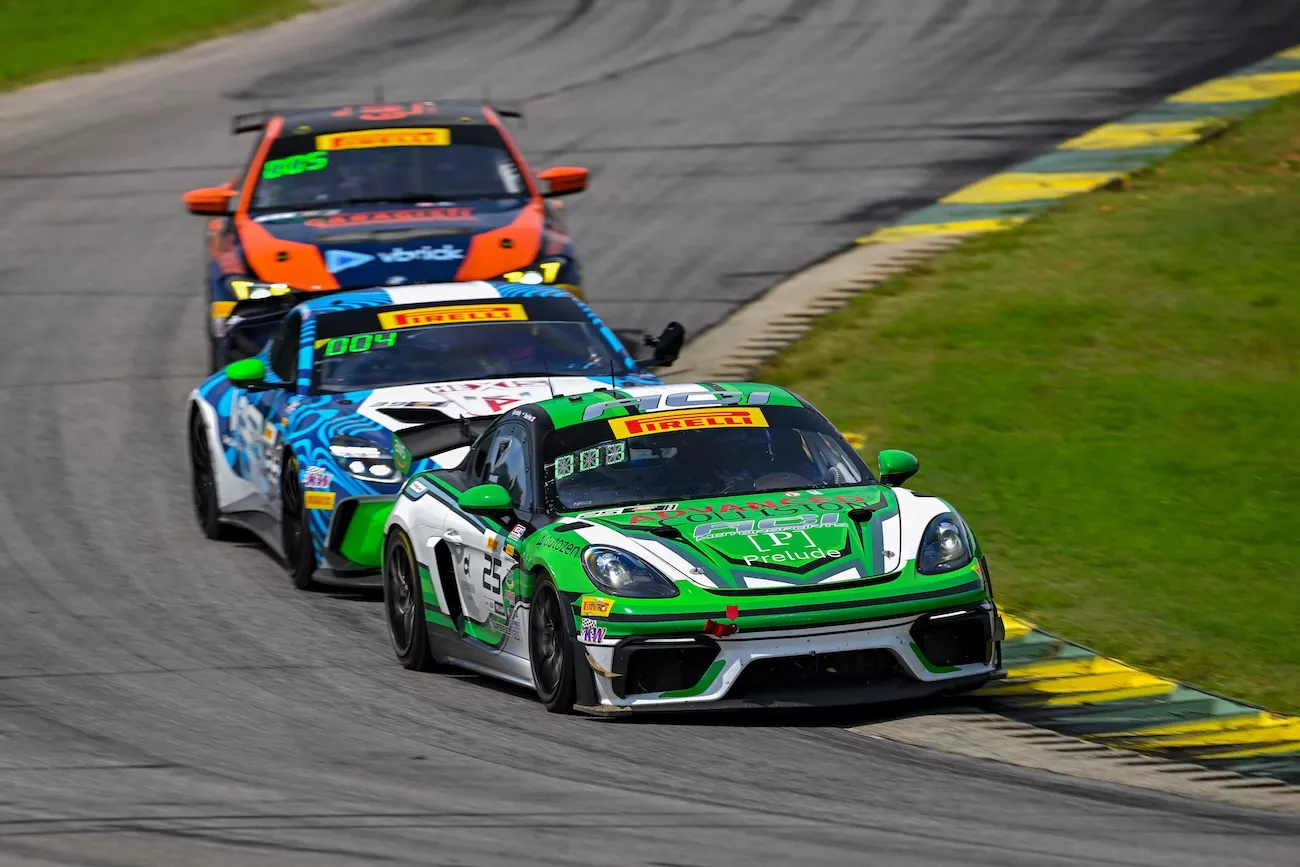

Door-to-door racing with factory-built GT4 machines—pro and amateur drivers battle it out in high-stakes sprint and endurance races.
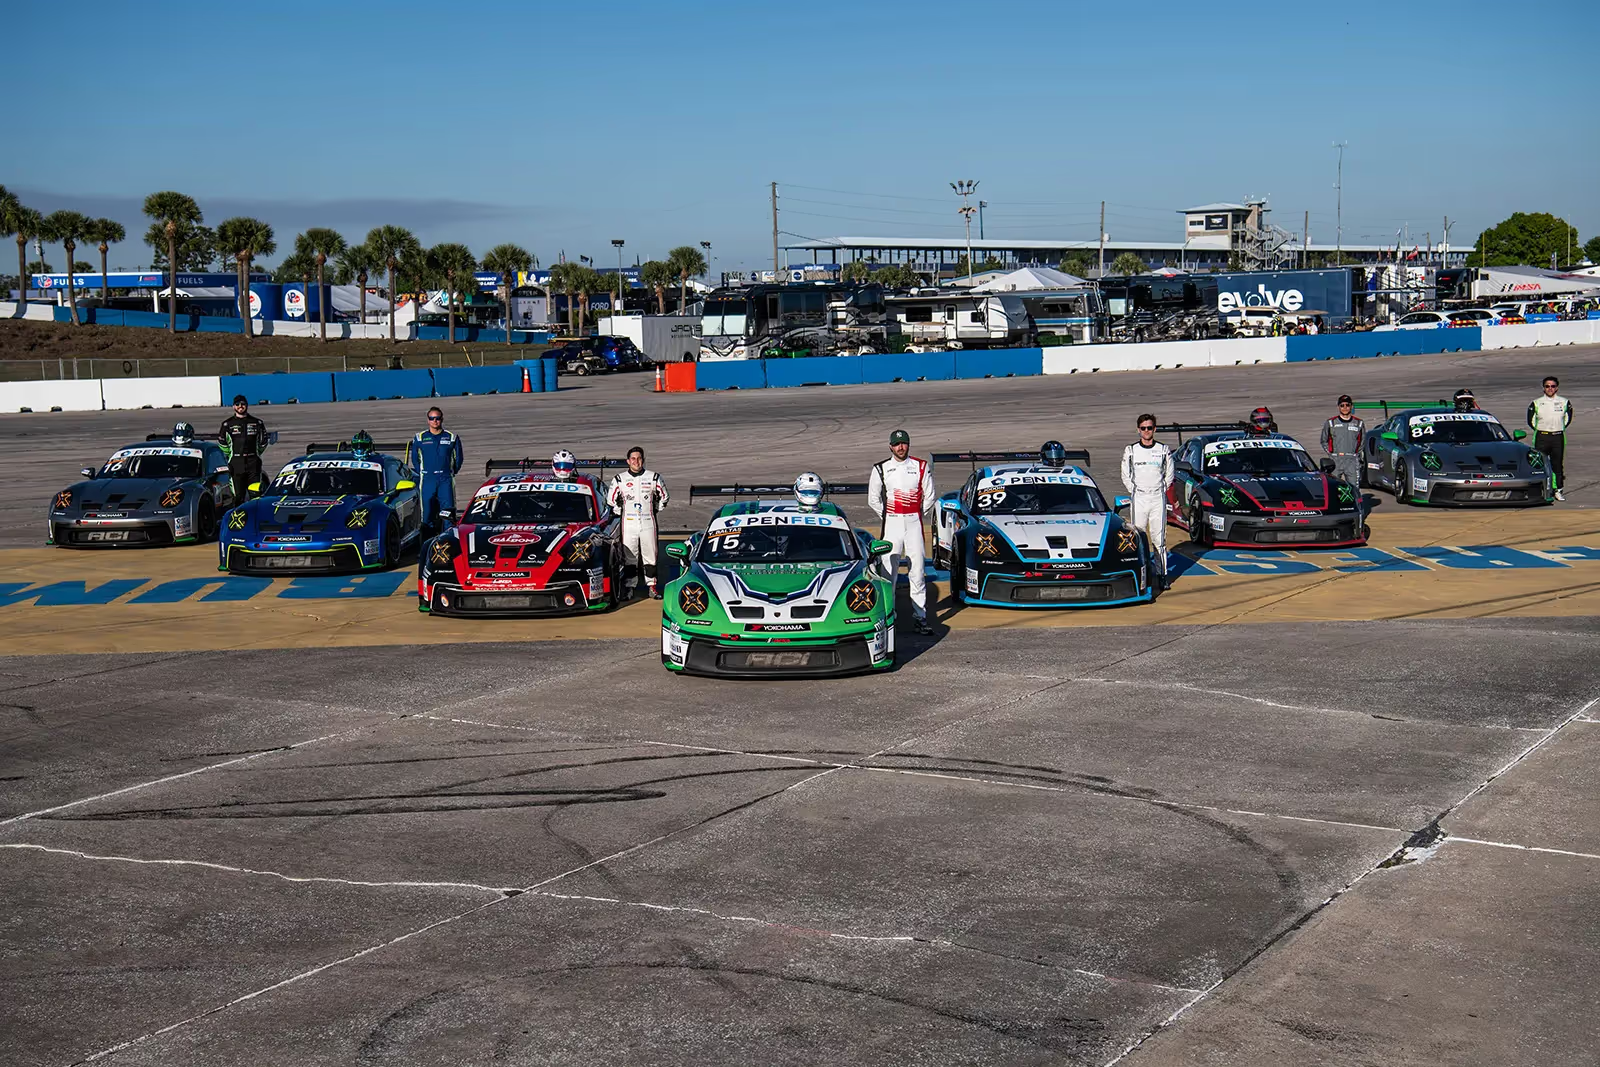

One make. One mission. Identical Porsche 911 GT3 Cup cars, flat-out racing, and rising stars chasing the next level.
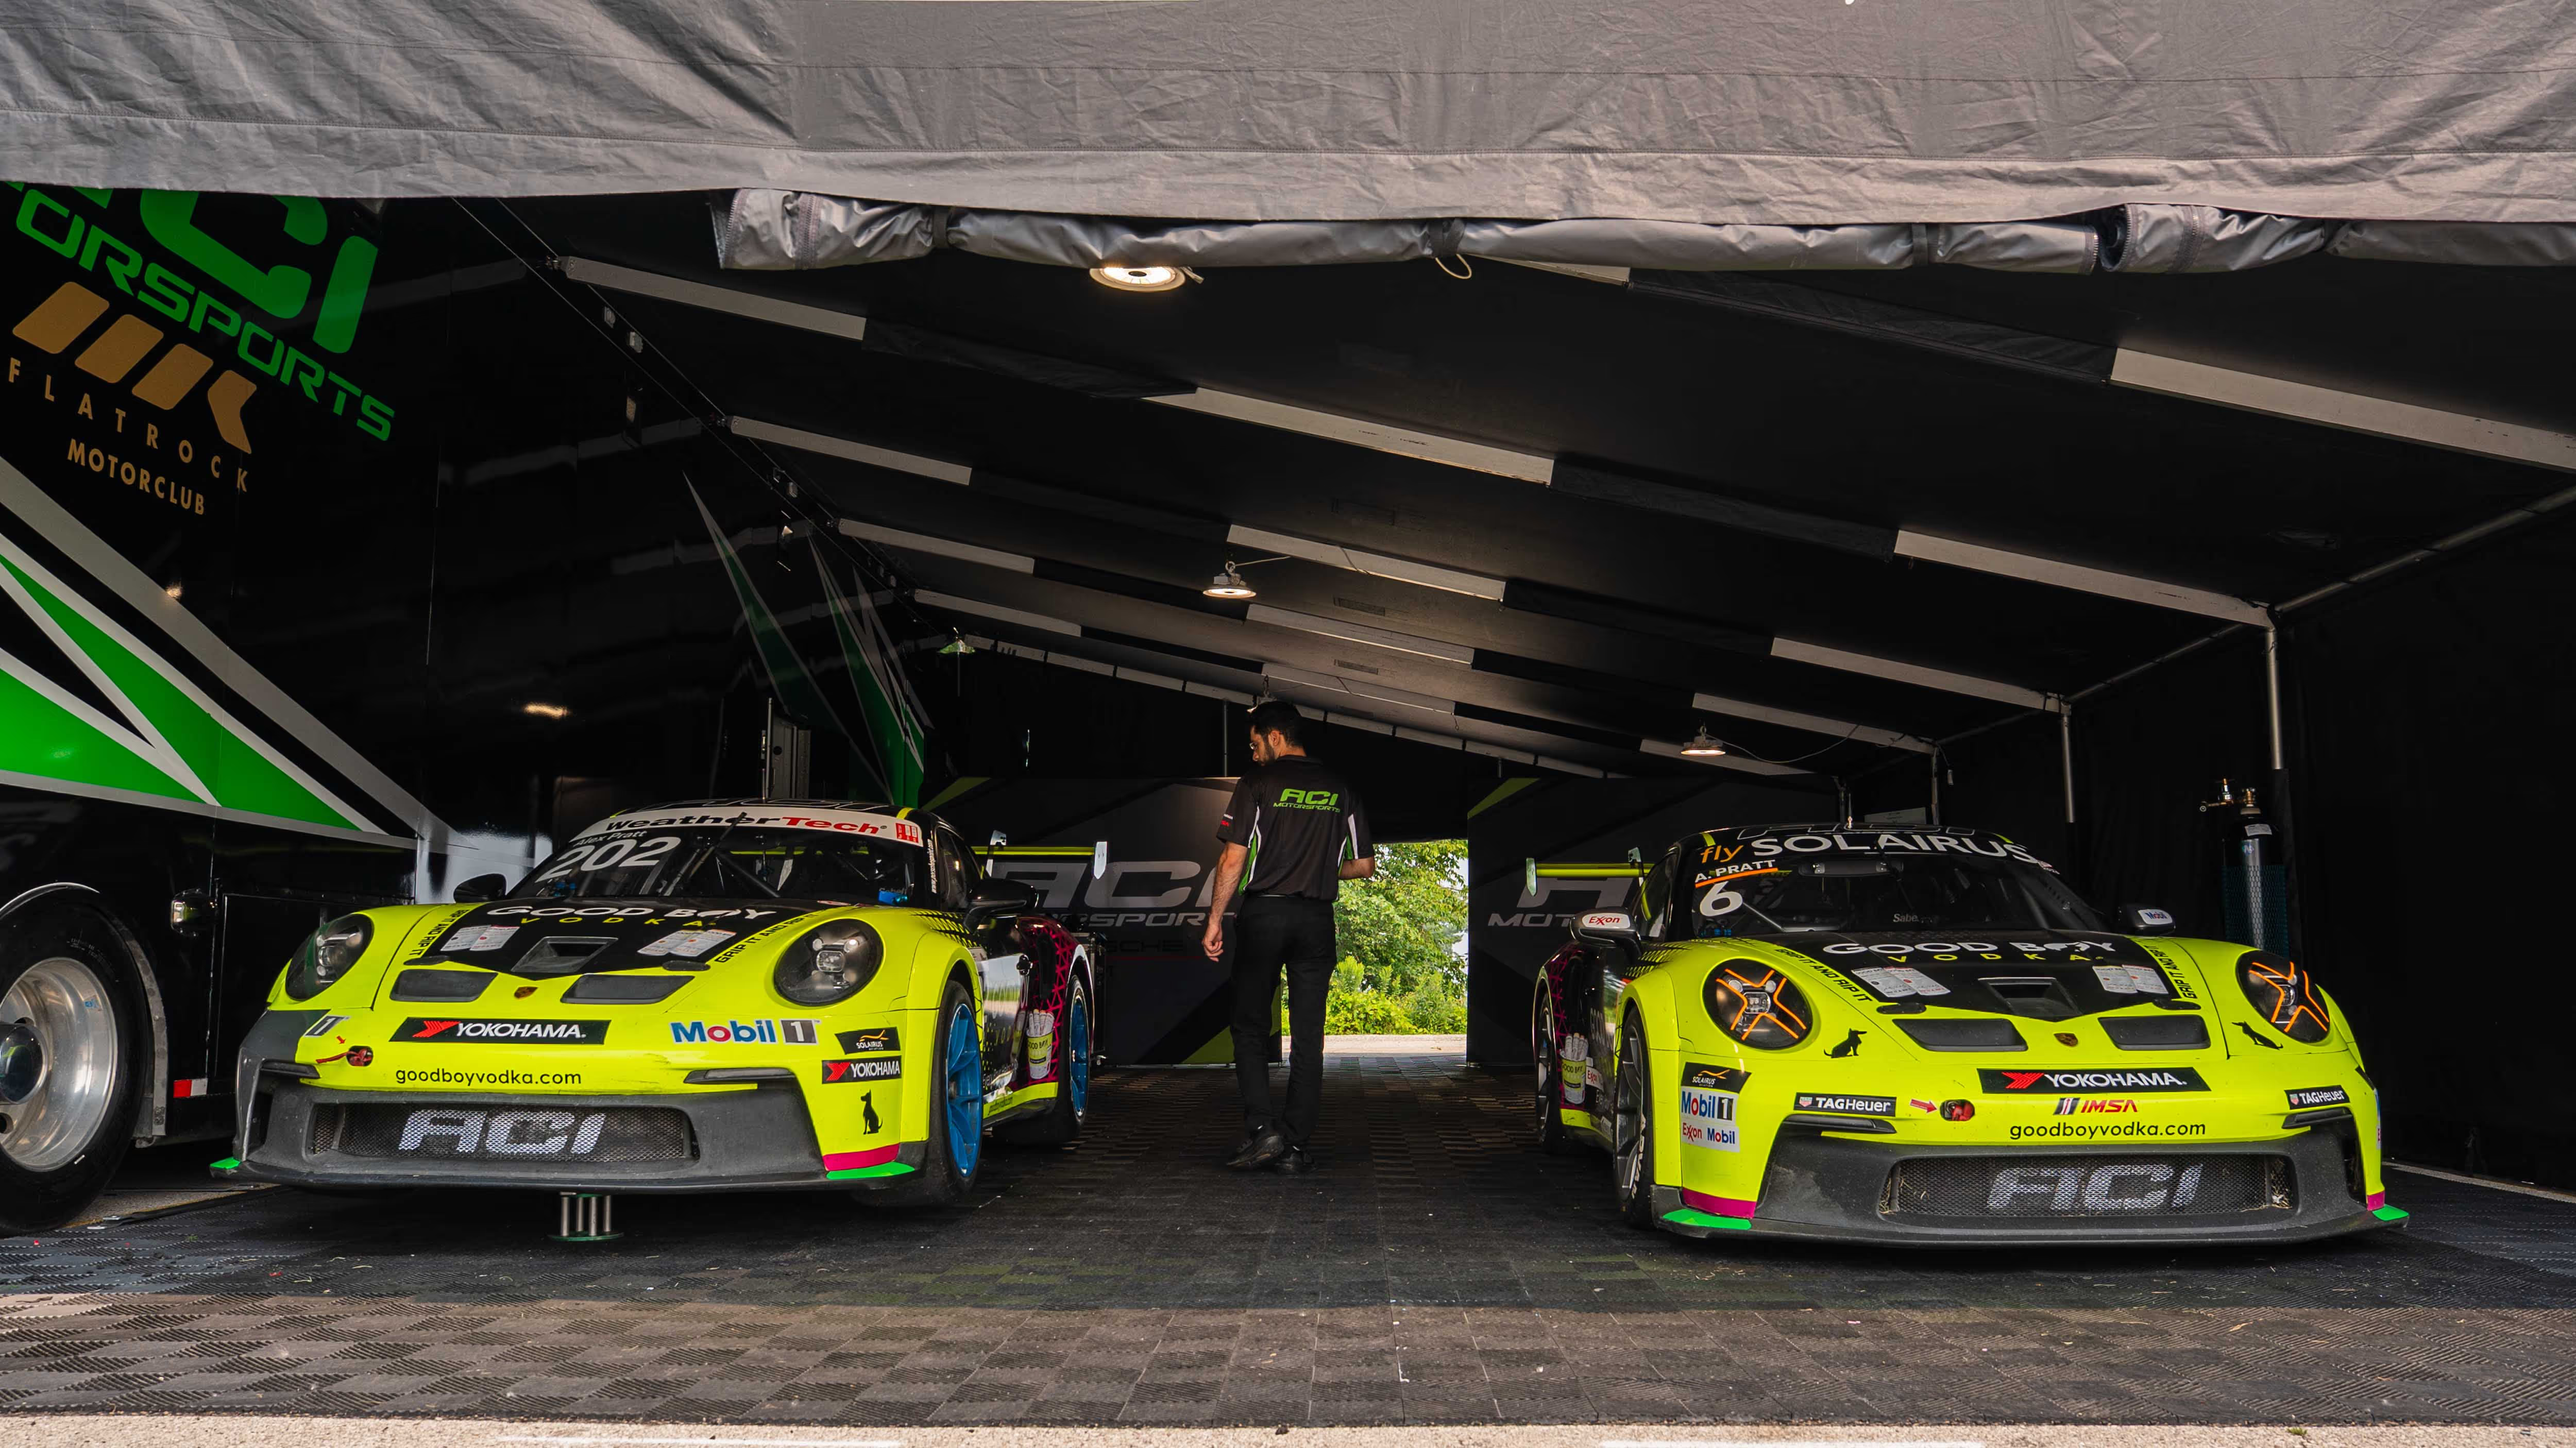

The proving ground for Porsche talent—accessible, competitive racing in 718 Cayman and 911 GT3 Cup cars.
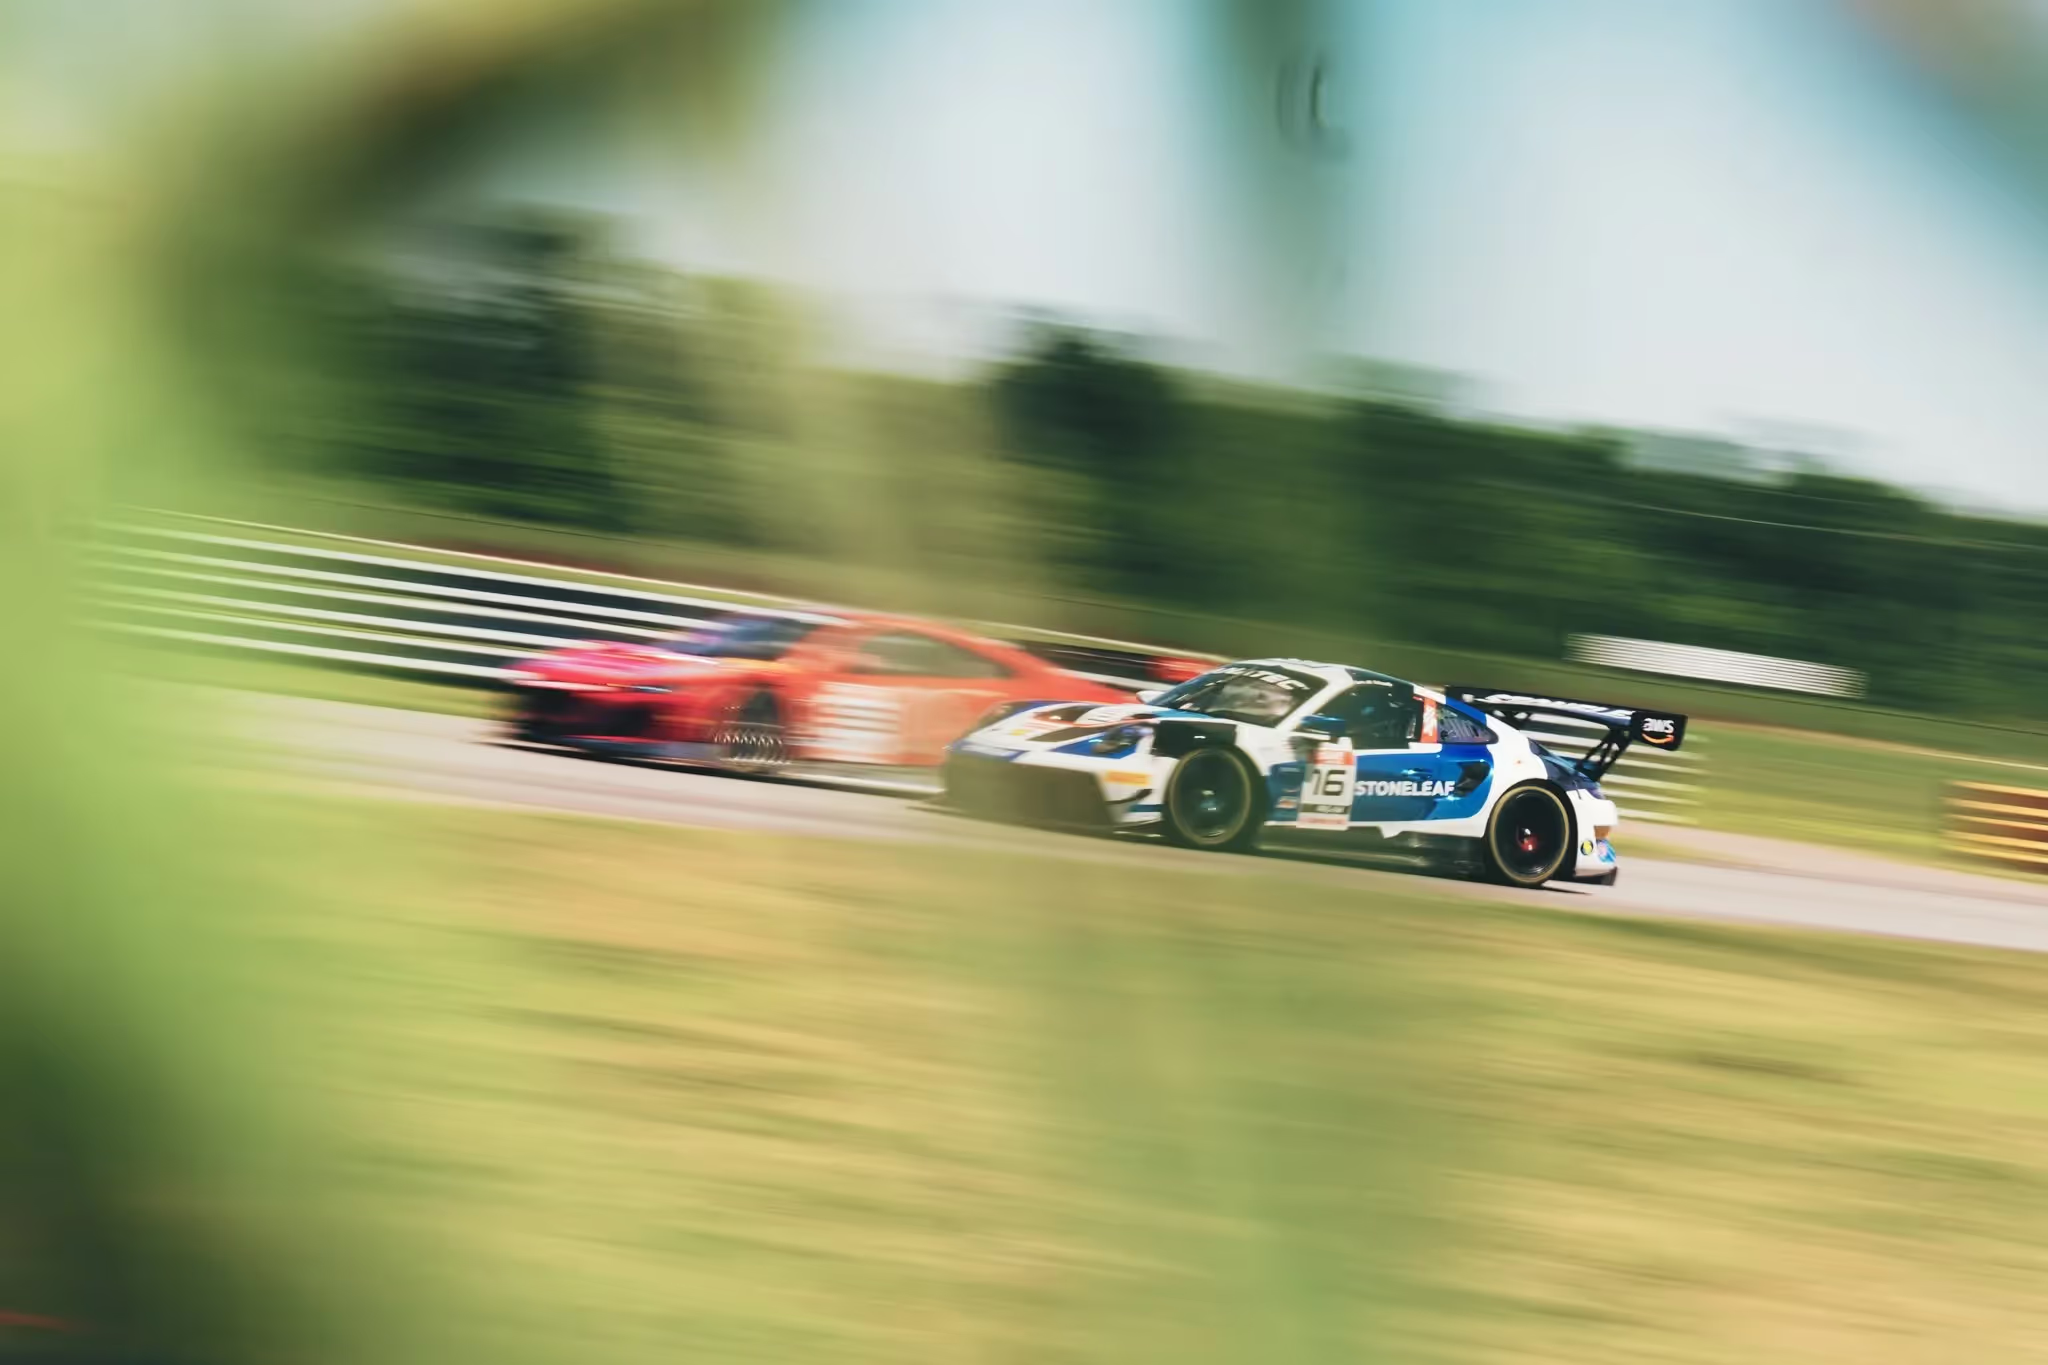

World-class GT3 racing at its finest—top teams, pro drivers, and pure speed across North America’s best tracks.